
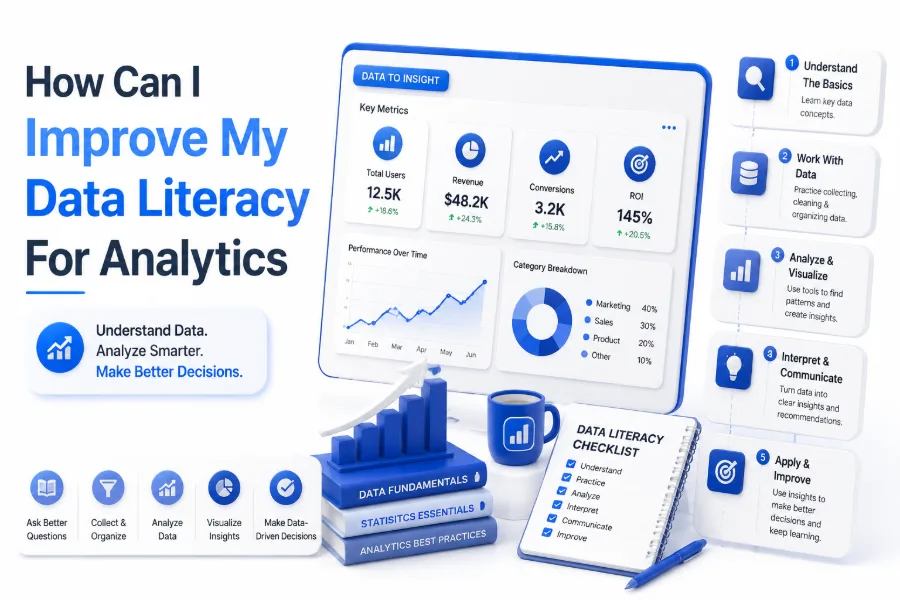
Data has become an important part of decision-making across almost every industry. Businesses use analytics to understand customer behavior, improve operations, measure performance, and identify new opportunities. However, working effectively with data requires more than knowing how to read charts or use analytics tools. It requires strong data literacy skills.
Many professionals ask, “how can i improve my data literacy for analytics” because modern workplaces increasingly depend on accurate data interpretation. Data literacy helps people understand where information comes from, analyze patterns, identify mistakes, and communicate insights clearly.
Improving data literacy is not only about learning technical skills. It also involves developing the ability to ask better questions, evaluate information critically, and connect data findings with real business goals. With consistent practice and the right learning approach, anyone can build stronger confidence in using data for analytics.
What Is Data Literacy in Analytics
Data literacy refers to the ability to read, understand, analyze, and communicate information using data. In analytics, it means being able to work with datasets, recognize meaningful patterns, and use insights to support better decisions.
A data-literate person does not necessarily need to become a professional data scientist. Instead, they need enough knowledge to understand analytical reports, question results, and make informed choices based on reliable information.
Data literacy combines several skills, including statistical thinking, data interpretation, visualization knowledge, and communication abilities. These skills help professionals avoid incorrect conclusions and use analytics more effectively in their roles.
Why Data Literacy Matters for Analytics
Analytics is only valuable when people can correctly interpret and apply data. Without data literacy, teams may misunderstand reports, overlook important trends, or make decisions based on inaccurate assumptions.
Strong data literacy allows employees across different departments to work better with analytics teams. Marketing specialists, managers, and business leaders can all benefit from understanding how data supports their goals.
Learn the Basics of Data Concepts
The first step to improving data literacy is building a strong foundation in basic data concepts. Before analyzing information, you need to understand what data represents and how it is collected.
Start by learning common terms such as datasets, variables, dimensions, metrics, measurements, and data sources. These concepts create the foundation needed to understand analytics reports and dashboards.
You should also learn the difference between structured and unstructured data. Structured data is organized in tables, while unstructured data includes formats such as text, images, and videos.
Understand Data Types and Measurements
Different types of data require different analysis methods. Learning about numerical, categorical, qualitative, and quantitative data helps you understand how information should be processed.
For example, customer age represents numerical data, while customer feedback categories represent categorical data. Knowing these differences helps you select appropriate analytics methods.
Important data concepts to learn:
- Data types and structures
- Data collection methods
- Basic statistical concepts
- Data quality principles
- Common analytics terminology
Develop Basic Statistical Skills
Statistics plays a major role in analytics because it helps identify patterns, relationships, and trends. You do not need advanced mathematics, but understanding basic statistical concepts can greatly improve your analytical abilities.
Start with concepts such as averages, percentages, distributions, correlations, and probability. These skills help you interpret reports and understand whether changes in data are meaningful.
For example, knowing the difference between correlation and causation prevents incorrect conclusions. Two events happening together does not always mean one directly causes the other.
Practice Reading Statistical Results
Reading statistical results requires asking questions about the data. Look at sample sizes, trends, variations, and possible limitations before making decisions.
Analytics professionals often examine multiple factors before reaching conclusions. Developing this habit improves your ability to evaluate information carefully.
Basic statistical skills to practice:
| Skill | Purpose |
|---|---|
| Mean and median | Understand typical values |
| Percentage analysis | Compare changes and growth |
| Correlation | Identify relationships |
| Probability | Estimate possible outcomes |
| Data distribution | Understand patterns and variations |
Improve Your Data Visualization Skills
Data visualization makes complex information easier to understand. Charts, graphs, and dashboards help people quickly identify trends and compare important information.
Improving your visualization skills means learning how different chart types communicate different messages. A line chart may show changes over time, while a bar chart may compare categories.
Good visualizations focus on clarity rather than decoration. The goal is to present information in a way that helps people understand the main message quickly.
Learn Common Analytics Visualization Tools
Many organizations use tools such as spreadsheets, business intelligence platforms, and dashboard software for reporting. Learning these tools can improve your ability to work with analytical information.
Popular tools include spreadsheet applications, data visualization platforms, and reporting systems. Practicing with real datasets is one of the best ways to develop confidence.
Ways to improve visualization skills:
- Study effective dashboards
- Practice creating charts
- Remove unnecessary visual elements
- Focus on important metrics
- Explain insights using simple language
Practice Working With Real Data
Theory alone is not enough to improve data literacy. Regular practice with real datasets helps you understand how analytics works in practical situations.
You can start with simple datasets related to sales, customer behavior, website traffic, or business performance. Analyze the information and try to identify patterns or trends.
Working with real examples helps you develop problem-solving skills. It teaches you how to clean data, find useful information, and communicate your findings.
Use Public Data Sources for Practice
Many organizations provide free datasets that beginners can use for learning. These datasets allow you to practice analysis without needing access to company information.
Try creating reports, answering questions, and building simple dashboards from these datasets. Each project improves your confidence and analytical thinking.
Good practice activities include:
- Analyzing monthly sales trends
- Comparing customer segments
- Creating performance dashboards
- Finding patterns in survey results
- Writing short data summaries
Learn How to Ask Better Data Questions
Good analytics starts with good questions. Data literacy is not only about reading numbers but also knowing what information you need and why it matters.
A weak question may produce unclear results, while a focused question can lead to valuable insights. For example, instead of asking “Why are sales lower?” ask “Which customer segment experienced the largest sales decline?”
Learning to create clear questions helps you collect relevant data and perform more meaningful analysis.
Connect Data With Business Goals
Analytics should support real objectives. Numbers alone do not create value unless they help solve problems or improve decisions.
When analyzing data, always consider the purpose behind the analysis. Ask how the findings can influence strategies, operations, or customer experiences.
Better analytical questions include:
- What factors influence customer retention?
- Which products generate the highest revenue?
- Where are operational problems occurring?
- What trends require immediate attention?
Improve Your Data Communication Skills
Finding insights is only part of analytics. Explaining those insights clearly is equally important. Data communication helps others understand findings and make informed decisions.
Avoid using complicated technical language when presenting results. Focus on explaining what the data means, why it matters, and what action should be taken.
Strong communication connects analytics with real-world decisions. Professionals who can explain data clearly often create more impact within their organizations.
Tell Stories With Data
Data storytelling combines analysis, visuals, and explanations to create meaningful messages. Instead of presenting numbers alone, it provides context and highlights important conclusions.
A good data story explains the situation, presents evidence, and recommends possible actions. This approach makes analytical reports more useful for decision-makers.
Build Skills With Analytics Tools
Learning analytics tools can improve your ability to work with data efficiently. While tools are not the only part of data literacy, they provide practical ways to analyze and present information.
Start with beginner-friendly tools before moving to advanced platforms. Focus on understanding how tools support analysis rather than memorizing every feature.
Recommended Tools to Practice
Different tools serve different purposes in analytics. Choose tools based on your goals and career needs.
Useful analytics tools include:
- Spreadsheet software for basic analysis
- SQL for working with databases
- Business intelligence tools for dashboards
- Data visualization platforms for reporting
- Programming languages for advanced analytics
Create a Continuous Learning Routine
Data literacy improves through regular practice and continuous learning. Analytics methods, tools, and technologies continue to change, so staying updated is important.
Set aside time each week to practice analyzing data, learn new concepts, or review analytical reports. Small consistent efforts create stronger skills over time.
Build Your Own Analytics Projects
Personal projects provide valuable experience. Create projects based on topics that interest you and document your process.
A portfolio of small analytics projects can demonstrate your abilities and help you identify areas where you need more improvement.
Conclusion
Improving data literacy requires a combination of technical knowledge, analytical thinking, and communication skills. You do not need to become a data expert overnight. Progress comes from learning core concepts, practicing with real datasets, and gradually building confidence.
By improving your ability to understand information, evaluate patterns, and communicate insights, you can make better decisions and contribute more effectively in data-driven environments. Whether you work in business, marketing, finance, or technology, stronger data skills can improve your professional capabilities.
If you are wondering how can i improve my data literacy for analytics, start with small steps such as learning basic concepts, practicing analysis, and developing the habit of asking better questions. Consistent practice will help you become more comfortable and effective when working with data.
FAQ
What is data literacy in analytics
Data literacy in analytics means having the ability to understand, analyze, interpret, and communicate data effectively. It helps people use information correctly to identify trends and make better decisions.
Do I need coding skills to improve data literacy
Coding skills are helpful but not required for basic data literacy. Many professionals improve their skills using spreadsheets, dashboards, and visualization tools before learning programming.
How long does it take to improve data literacy
The time required depends on your goals and practice routine. With regular learning and hands-on projects, many people can develop strong foundational skills within a few months.
Which tools should beginners learn for analytics
Beginners can start with spreadsheet tools, dashboard platforms, and basic database concepts. Learning SQL and visualization software can further improve analytical abilities.
Why is data communication important in analytics
Data communication helps people understand analytical findings and take action. Clear explanations allow teams and leaders to use insights effectively instead of only viewing numbers.
0 Comments